1/31/10

ANTICIPATED:US DOLLAR RALLY


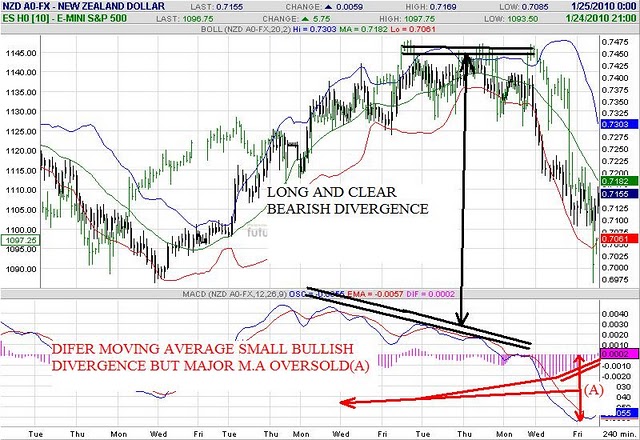
THIS IS WHAT WE SAID ON 01/25/10 CHART BELOW WHAT HAPPENED.


CORRET!


THIS IS WHAT WE SAID ON 01,25,10,CHART BELOW WHAT HPPENED.


ACCORDING WITH THE MARKETS SYNERGIES THE CORRETION STILL UNDERWAY,THE WEAKIEST TIMES SERIES THE MARKERT (S&P)  AND NZD IN ALLL THEIR CROSSES.


                                                 DISCLAIMER OF WARRANTIES .

Past performance should not be taken as an indication or guarantee of future performance, and no representation or warranty, express or implied is made regarding future performance. Opinions and estimates reflect a judgment at original date of publication by FOREX CRITERIA and are subject to change.Foreign currency and financial instruments are subject to fluctuations in exchange rates that may have a positive or adverse effect on the value, price or income of such Investment.FX trading uses complex instruments, typically involve a high degree of risk and are intended for use only to sophisticated investors who are capable of understanding and assuming the risks involved.

1/24/10

MARKET SYNERGIES


As we said in the last Post,the US Dollar did indeed ,went up, we..ll follow the actual Uptrend(A),that must continue (B). 


In the chart above,there is bullish divergence like the short Bullish Divergence in 240 Min  Time Frame.So we expect a small uptren correction in all th series shown,in order with the Sinergy we are considering.


The Bullish Divergence in the contrarian Indicator (Below),coincident with the S&P Fall.Notice that in the above chart we have overlap the NZD (New Zealand $),that hehave in the same maner as it does al the NZD Crosses in a significant statistic coincidence.Also the Major Moving Divergence is too oversold (A), despite the short Divergence vith two paralell short lines.


Today we,ll see some key market Sinergies.In the chart above a clear bullish divergence,VXN and VIX,both are Contrarian Indicator,that indicate an inminet market fall. 


                         DISCLAIMER OF WARRANTIES .


Past performance should not be taken as an indication or guarantee of future performance, and no representation or warranty, express or implied is made regarding future performance. Opinions and estimates reflect a judgment at original date of publication by FOREX CRITERIA and are subject to change.Foreign currency and financial instruments are subject to fluctuations in exchange rates that may have a positive or adverse effect on the value, price or income of such Investment.FX trading uses complex instruments, typically involve a high degree of risk and are intended for use only to sophisticated investors who are capable of understanding and assuming the risks involved.




1/18/10

US DOLLAR:ATTENTION.CABLE ENDING UPTREND MOVE


THE US DOLLAR COULD BE IN A BRINK OF A FAST UPTREND  MOVE THIS WEEK!
BESIDES THIS, WE DO NOT THINK THE US DOLLAR IS DEFINITETLY AT THE LONG TERM UPTREND CYCLE MOVE SO LONG EXPECTED.
(A) IS THE SAME PATTERN IN 120 MIN (BELOW) AND IN DAILY CHART ABOVE.


IN THE LAST POST WE CONSIDERED THE DX IN A SHORT TERM TOP... BUT ...WE BETTER STAY TUNED TO FOLLOW HOW LARGE IS THE PRESENT MOVE DX 120 Min TIME FRAME.
EVEN IF WE COMBINE WITH THE BULLISH PATTERN IN THE DX DAILY CHART ABOVE.


IF YOU COMPARE THE ACTUAL CHART WITH ITS EQUIVALENT IN THE LAST POST THE PREDITION IS ALMOST COMPLETED EXCEPT FOR THE YEN.
IN THE NEXT POST WE WILL TRAY TO STABLISH THE DIFFENCE ON THE RELATIVE STRENGTH, THAT IS THE MOST DIFFICULT PREDICTION ISSUE ON FX MARKET. NEVERTHELESS I AM NOT VERY CONFIDENT IN THE DURATION OF THE CABLE MOVE.


AGAIN WE WERE CORRECT IN OUR PREDICTION ABOUT THE UPTRED OF THE BP.


WE WERE CORRECT ON CABLE LAST POST BUT AS WE SAID BP IS NOT A LEADER CURRENCY BECAUSE THEIR CROSSES DO NOT ALWAYS BEHAVE IN THE SAME WAY.
THIS TIME THERE ARE A CORRELATION DEPENDINDG WHICH ONE IS THE STRONGER/WEAKER IN THE PRESENT CYCLE. YEN AND CABLE SIDEWAYS.

                                                  DISCLAIMER OF WARRANTIES .

Past performance should not be taken as an indication or guarantee of future performance, and no representation or warranty, express or implied is made regarding future performance. Opinions and estimates reflect a judgment at original date of publication by FOREX CRITERIA and are subject to change.Foreign currency and financial instruments are subject to fluctuations in exchange rates that may have a positive or adverse effect on the value, price or income of such Investment.FX trading uses complex instruments, typically involve a high degree of risk and are intended for use only to sophisticated investors who are capable of understanding and assuming the risks involved.

1/13/10

DX AS EXPECTED, NZD CROSSES FOLLOWS TREND, CABLE AWAKENINGS

   THE  NZD CROSSES  AND THE DOW JONE BEHAVE IN THE SAME MANNER, SO WE HAVE AN EXCELENT INDICATOR, BECAUSE THE COVARIANCE  BETWEEN THE MENTIONED TIME SERIES ALWAYS TEND TO CERO.


AS WE SAID DAYS AGO THE US$ WAS IN A TRADING
RANGE, PEFORMING A MEDIUM TERM TOP.


   THE PAIR NZDJPY & CHFJPY IN 240 MIN ARE IN A SHORT TERM CORRECTION, BUT OUR FORESCAST IS THAT A MEDIUM TERM UPTREND FOLLOWS.


   NZDJPY & NZDCHF 120 IS PERFORMING A SHORT TERM CORRECTION.


THE BRITISH POUND (CABLE) IS AWAKENING PERFORMING A SHORT TERM DIVERGENCES THAT WILL REVALUE CABLE AGAINTS ITS CROSSES. NEVERTHELESS, THIS SITUATION IS ANORMAL.  THIS IS THE REASON WHY THE BP IS NOT CONSIDER A LEADER CURRENCY DUE TO  ITS IRREGULAR PERFORMANCE WITH  ITS CROSSES INVALID IT TO BE A SECURE CANDIDAT TO TRADE WITH.


IN THE CHART BELOW GBPEUR & GBP$  WE INTRODUCE , TWO NEWS CONCEPTS.
1)TIME SERIES COVARIANCE.
2)TIME SERIES CONVERGENCE.
WHEN WE FIND BOTH PLUS AN INDICATOR OF DIVERGENCE WE ARE IN PRESENCE  OF A STRONG PREDICTION PATTERN IN THE FOREX MARKET.


CHART BELOW SHOWING TWO NEW PATTERN PLUS THE CLASSIC DIVERGENCE.


DISCLAIMER OF WARRANTIES .

Past performance should not be taken as an indication or guarantee of future performance, and no representation or warranty, express or implied is made regarding future performance. Opinions and estimates reflect a judgment at original date of publication by FOREX CRITERIA and are subject to change.Foreign currency and financial instruments are subject to fluctuations in exchange rates that may have a positive or adverse effect on the value, price or income of such Investment.FX trading uses complex instruments, typically involve a high degree of risk and are intended for use only to sophisticated investors who are capable of understanding and assuming the risks involved.

1/6/10

BULLISH TREND CONFIRMATION


AUD$ & AUDCAD 120 Min.follows a Bullish trend. This means that the  AUD$ is the strongest against cross-rate, except with the NZD that confirms the last forecast.


AUDCHF & AUDJPY 120 Min follows the Bullish Trend.


AUDEUR & AUDGBP 120 Min.Follows bullish trend.


The cross-rate AUDNZD does not show any significant pattern.
So, we consider that the NZD AO-FX or NZD A0-FX are in a trading range.
Both of them are the strongest currency although the yield is in favor of the NZD A0-FX.

DISCLAIMER OF WARRANTIES .
Past performance should not be taken as an indication or guarantee of future performance, and no representation or warranty, express or implied is made regarding future performance. Opinions and estimates reflect a judgment at original date of publication by FOREX CRITERIA and are subject to change.Foreign currency and financial instruments are subject to fluctuations in exchange rates that may have a positive or adverse effect on the value, price or income of such Investment.FX trading uses complex instruments, typically involve a high degree of risk and are intended for use only to sophisticated investors who are capable of understanding and assuming the risks involved.

1/4/10

YEN CARRY TRADE & DX TRADING RANGE


DX WEEKLY: Waiting for a double bottom?


DX 120 MIN BAR:Seems to be in a trading Range, toppy. Close long position.


When the Market is following an uptrend, all the NZD crosses behave in the same manner. Then, to figure out which is the best buy: follow the NZDAUD relationships. The Weakest the Japanese Yen, the Strongest the NZD. Then Carry Trade NZDJPY.


AUD$ &AUDCAD 120 MIN BAR:Uptrend follows.


AUDCHF & AUDJPY 120 MIN BAR: Australian$ &New Zealand$, and their crosses are leading indicator in the FX Market. Up trend Follows.

DISCLAIMER OF WARRANTIES .
Past performance should not be taken as an indication or guarantee of future performance, and no representation or warranty, express or implied is made regarding future performance. Opinions and estimates reflect a judgment at original date of publication by FOREX CRITERIA and are subject to change.Foreign currency and financial instruments are subject to fluctuations in exchange rates that may have a positive or adverse effect on the value, price or income of such Investment.FX trading uses complex instruments, typically involve a high degree of risk and are intended for use only to sophisticated investors who are capable of understanding and assuming the risks involved.

1/2/10

AUD$ & AUSCAD DAY VS AUD$ & AUSCAD - 120 MIN BAR.

Today we compare two overlapping cross-rates:
1. the AUS$ &AUDCAD in Daily Basis versus
2. the AUS$ &AUDCAD 120 Min Bar.
The Daily market analysis shows a Bearish Divergence that is pulling the market down. However,  is there a Bearish Divergence that "must" pull the market up?
Be aware that the market analysis in  Daily Basis is most powerful when there is a Pattern either up or down.
In fact, all the graphs we plot in this Blog have the same Pattern, but the algorith search--in Real Time and in all time Frames-- for either lineal 1, 2, 3 ... or Fibonanci Series 1, 2, 3, 5, 8...
The 120 Min Bar shows a not completed Bullish Divergence (Ideal Pattern will be when A1 tend to Zero). 
Finally, the 120 Min does not show any conclusive pattern (A2).
We will follow the 120 Min, but the Daily Bar point to a Bearish correction.
PD.The Daily pattern has a significant self-similarity with the pattern showed in the 15 Min Bar (12,17,09) as a Fractal mode. 
Charts are taken from Futures Source.

DISCLAIMER OF WARRANTIES
Past performance should not be taken as an indication or guarantee of future performance, and no representation or warranty, express or implied is made regarding future performance. Opinions and estimates reflect a judgment at original date of publication by FOREX CRITERIA and are subject to change.Foreign currency and financial instruments are subject to fluctuations in exchange rates that may have a positive or adverse effect on the value, price or income of such Investment.FX trading uses complex instruments, typically involve a high degree of risk and are intended for use only to sophisticated investors who are capable of understanding and assuming the risks involved